The Lifecycle of Data Analysis
A journey from Data Collection and Cleansing to Generate Actionable Insights
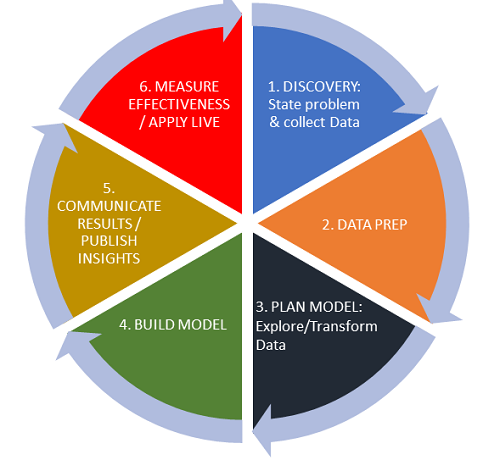
This simplified model gives you a starting point with which to build a data lifecycle that works for your organization.
1. Discovery
In this initial phase, you'll develop clear goals and a plan of how to achieve those goals. You'll want to identify where your data is coming from, and what story you want your data to tell. If you plan on hypothesis testing your data, this is the stage where you'll develop a clear hypothesis and decide which hypothesis tests you'll use (for an overview, see: hypothesis tests in one picture). One way to think about this phase is that you're focusing on the business requirements, rather than the data itself. Data can be collected in this stage, but you won't be working with the data. Rather, you'll just identify rough or vague areas of data that might be applicable to your goals.
I like to think of data collection here as like doing research in a public library. At initial stages of research, you simply grab every book in sight that has some connection to your topic. Then you sit down and sort through the books, casting aside those that aren't particularly relevant. That "sit down" stage is the next step: data prep.
2. Data Prep
In this second stage, the focus shifts from business requirements to data requirements. Data prep is every task involved with collecting, processing, and cleansing data. Perhaps one of the most important parts of this step is making sure that the data you need is actually available. Raw data is preferable to aggregate, although both types may be useful for comparison purposes. You may need to make adjustments to the amount or type of data you need, depending on what data is available.
In this early phase, data is collected but not analyzed. Data is captured through three main ways:
- Data acquisition: obtaining existing data from outside sources.
- Data entry: creating new data values from data inputted within the organization.
- Signal reception: capturing data created by devices.
A distribution and range may be obtained for the data, which forms a natural bridge to the next step.
3. Plan Model (Explore/Transform Data)
You've collected your data in Step 2, which may be structured (clearly defined with patterns), unstructured, or semi-structured. Now it's time to load and explore the data at hand.
Many techniques are available for loading data. A few examples:
- ETL (Extract, Transform & Load) transforms data using a set of business rules, before loading it into a sandbox.
- ELT (Extract, Load, and Transform) loads raw data into the sandbox then transforms the data.
- ETLT (Extract, Transform, Load, Transform) has two levels of transformation. The first transformation is often used to eliminate noise.
If the data is skewed, looking at a logarithmic distribution (assuming all the data is all positive) can help make sense of the data's underlying patterns. Take note of how many modes (peaks) your data has in this phase, as it can give you clues about the underlying populations. A unimodal (single) distribution may indicate a single population, while a multimodal (many peaked) distribution indicates multiple sources. Dirty data can be filtered in this phase, or simply removed. In this stage, you might also use tools and techniques like aggregation, integration, and data scrubbing.
4. Build the Model
Building a model involves two phases:
- Design the model: identify a suitable model (e.g. a normal distribution). This step can involve a number of different modeling techniques to identify a suitable model. These may include decision trees, regression techniques (like logistic regression), and neural networks.
- Execute the model: The model is run against the data to ensure that the model fits the data.
5. Communicate Results / Publish Insights
Typically, "communicating results" means that you communicate results within an organization while "publishing" refers to making your results available to entities outside the organization. By publishing your insights, you're effectively making your results impossible to recall. For example, you might send your results out to the public in a market report, or you might just send the results to one newspaper editor. Either way, it's impossible at the publishing stage to recall your findings. Data breaches or hacks also, unfortunately, fall under the umbrella of "publishing."
6. Operationalize / Measure Effectiveness
This final phase moves data from the sandbox into a live environment. Data is monitored and analyzed to see if the generated model is creating the expected results. If the results aren't as expected, you can return to any of the preceding phases to tweak the data.
Source: https://www.datasciencecentral.com/profiles/blogs/the-lifecycle-of-data